Technical Trade Alert: AAPL Chart Primed For Double-Digit Breakout (Price Target)
A technical analysis of Apple's stock chart revealed that AAPL could be primed for a near-term breakout. Here's what we uncovered, along with a potential price target for the stock.

Welcome to Wealthy VC’s inaugural edition of Technical Trade Alert, a new series dedicated to providing investors with simple trading setups that have the potential to generate big short-term returns for their portfolios.
Focused on the technical analysis of a company’s stock chart, in this edition of Technical Trade Alert, we put our in-house stock screener to work scanning the markets looking for stock charts with bullish technical setups that could be primed for a near-term breakout.
After completing a throughout scan, we analyzed many interesting charts, before ultimately deciding that the stock chart for Apple (NASDAQ: AAPL) had the strongest bullish setup, which we project is signalling potential short-term upside of +33.91%.
Below, we’ll explain our reasoning for this projection as well as outline the technical analysis we conducted on Apple’s stock chart.
Technical Trade Alert: Apple (NASDAQ: AAPL)
- Stock: Apple (NASDAQ: AAPL)
- Chart Pattern: Bull Flag
- Projected Price Target: $228.23
- Potential ROI: +33.91%
In technical analysis, Bull Flags are continuation chart patterns that, following a brief period of consolidation, signal that the previous uptrend will resume once the pattern has been completed. Bull Flags are typically found after a sharp upward price movement, with the consolidation period creating the pattern’s flag shape.
The Bull Flag gets its name because it resembles the shape of a flag on a pole. The pattern consists of downward-sloping upper and lower trendlines that form the shape of a rectangle or flag. The flagpole represents the sharp price movement that preceded the consolidation period, while the flag represents consolidation. The flagpole is the distance between the breakout above the previous resistance and the peak of the recent sharp rise before the current consolidation period.
Bull Flags are a nice pattern to work with since there is a simple formula we can use to calculate a stock’s potential price target.
The formula is as follows:
- Projected Breakout Price + Length of Flagpole = Potential Price Target
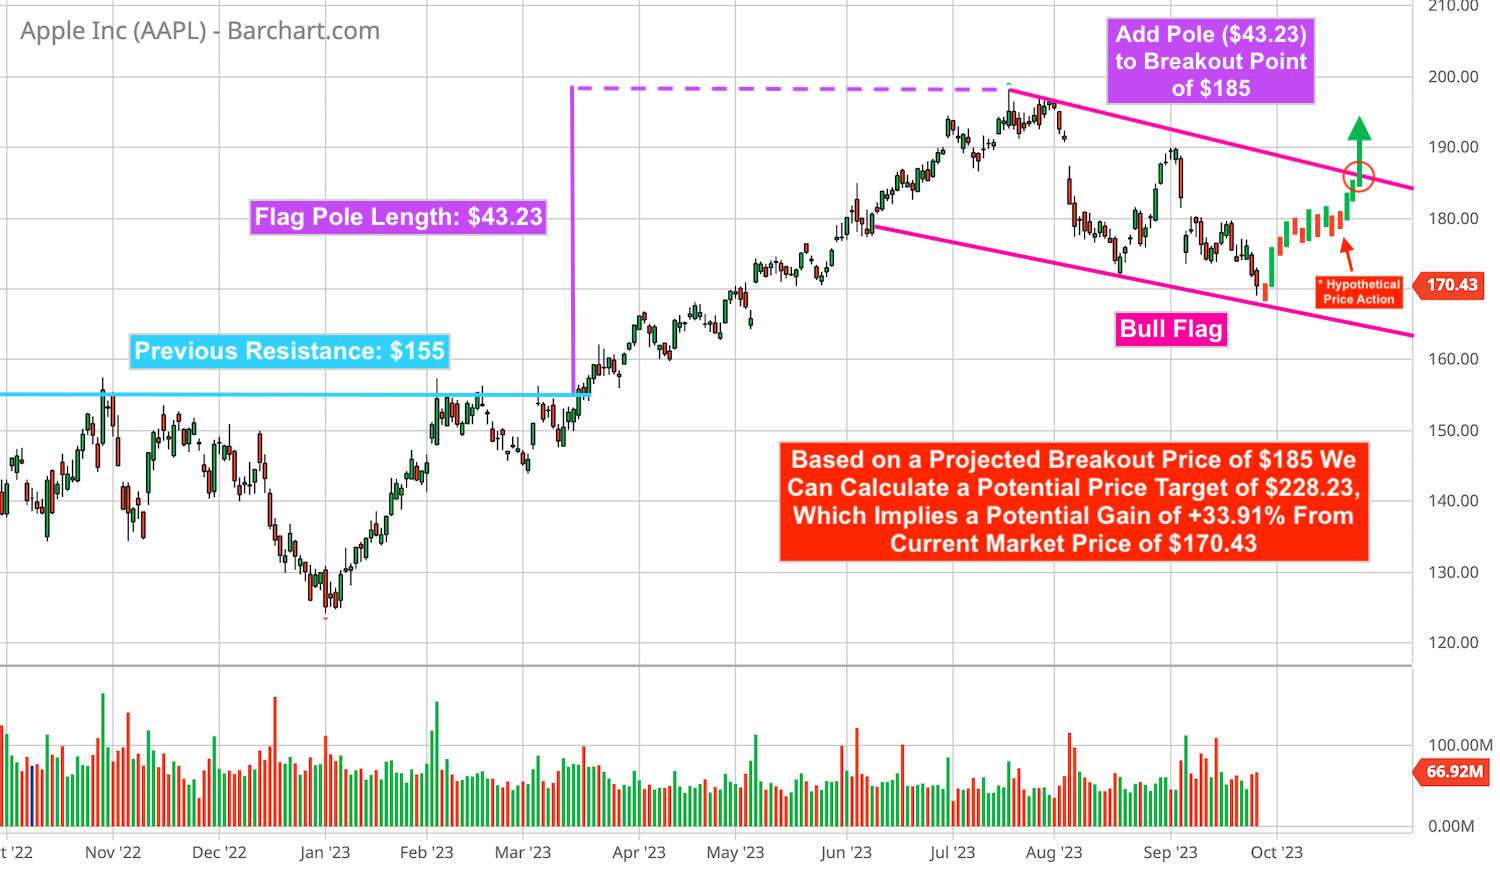
Based on a projected breakout price of $185 and a flagpole length of $43.23, we can calculate a potential price target of $228.23 on AAPL stock, which implies a potential near-term gain of +33.91%.
See our calculations below.
AAPL Price Target Calculation:
- AAPL Price: $170.43
- Length of Flagpole: $198.23 (sharp rise peak) – $155 (previous resistance break) = $43.23
- Projected Breakout Price: $185
- Price Target: $185 (projected breakout price) + $43.23 (flagpole) = $228.23
- Potential ROI: +33.91%
Apple (NASDAQ: AAPL) Technical Chart:
As is always the case when trading stocks, there’s never any guarantee that a trade will work out as planned, no matter how great the setup is, so please do your due diligence and utilize a stop loss when possible. If you’re unsure about something, consult with your broker or investment advisor.
Join the Discussion in the WVC Facebook Investor Group
Do you have a stock tip or news story suggestion? Please email us at Invest@WealthyVC.com.
Disclaimer: Wealthy VC does not hold a position in any of the stocks, ETFs or cryptocurrencies mentioned in this article.