Why a Newly Formed Fintech Alliance Has This Hidden Gem Stock on the Verge of a Major Technical Breakout
Recently signed deal between rising fintech stars XTM and Payfare is being touted as a "game changer" that's expected to quicken XTM's "path to profitability."

On the technical analysis front, news of the new fintech alliance appears to have catalyzed the recently formed bullish pattern on XTM’s stock chart, which, upon further analysis, could be poised for a major breakout.

Miami and Toronto-based fintech creator of disruptive payment innovations and staff management solutions XTM (CSE: PAID) (OTCQB: XTMIF) (FSE: 7XT) recently announced the signing of a deal with fellow fintech player Payfare (TSX: PAY). Payfare is a leading fintech company providing instant payout and digital banking solutions for the gig workforce.
Via its newly minted partnership with Payfare, XTM will integrate Payfare’s embedded finance and open API platform for card issuance, digital banking and instant payments. XTM’s proven Earned Wage Access (EWA) solution will take advantage of Payfare’s relationships and significant economies of scale to be able to enter and expand its offering across the U.S. market quickly. The integration is in progress, and XTM expects to start the full rollout in the second quarter of this year.
XTM says it will migrate the company’s current clients from its previous issuing bank so that all future banking and processing will be done through Payfare.
Speaking on the Payfare deal news, Marilyn Schaffer, XTM CEO, commented:
“We are confident that the singular advantage we gain through Payfare’s exponential success and their solid banking and processing relationships is a game changer for XTM’s growth in the U.S. market. Payfare’s economies of scale will bring our foundational work to its full potential, resulting in accelerating our rollout and quickening our path to profitability.”
Technical Analysis on XTM (CSE: PAID) – Potential Breakout Could Be Imminent
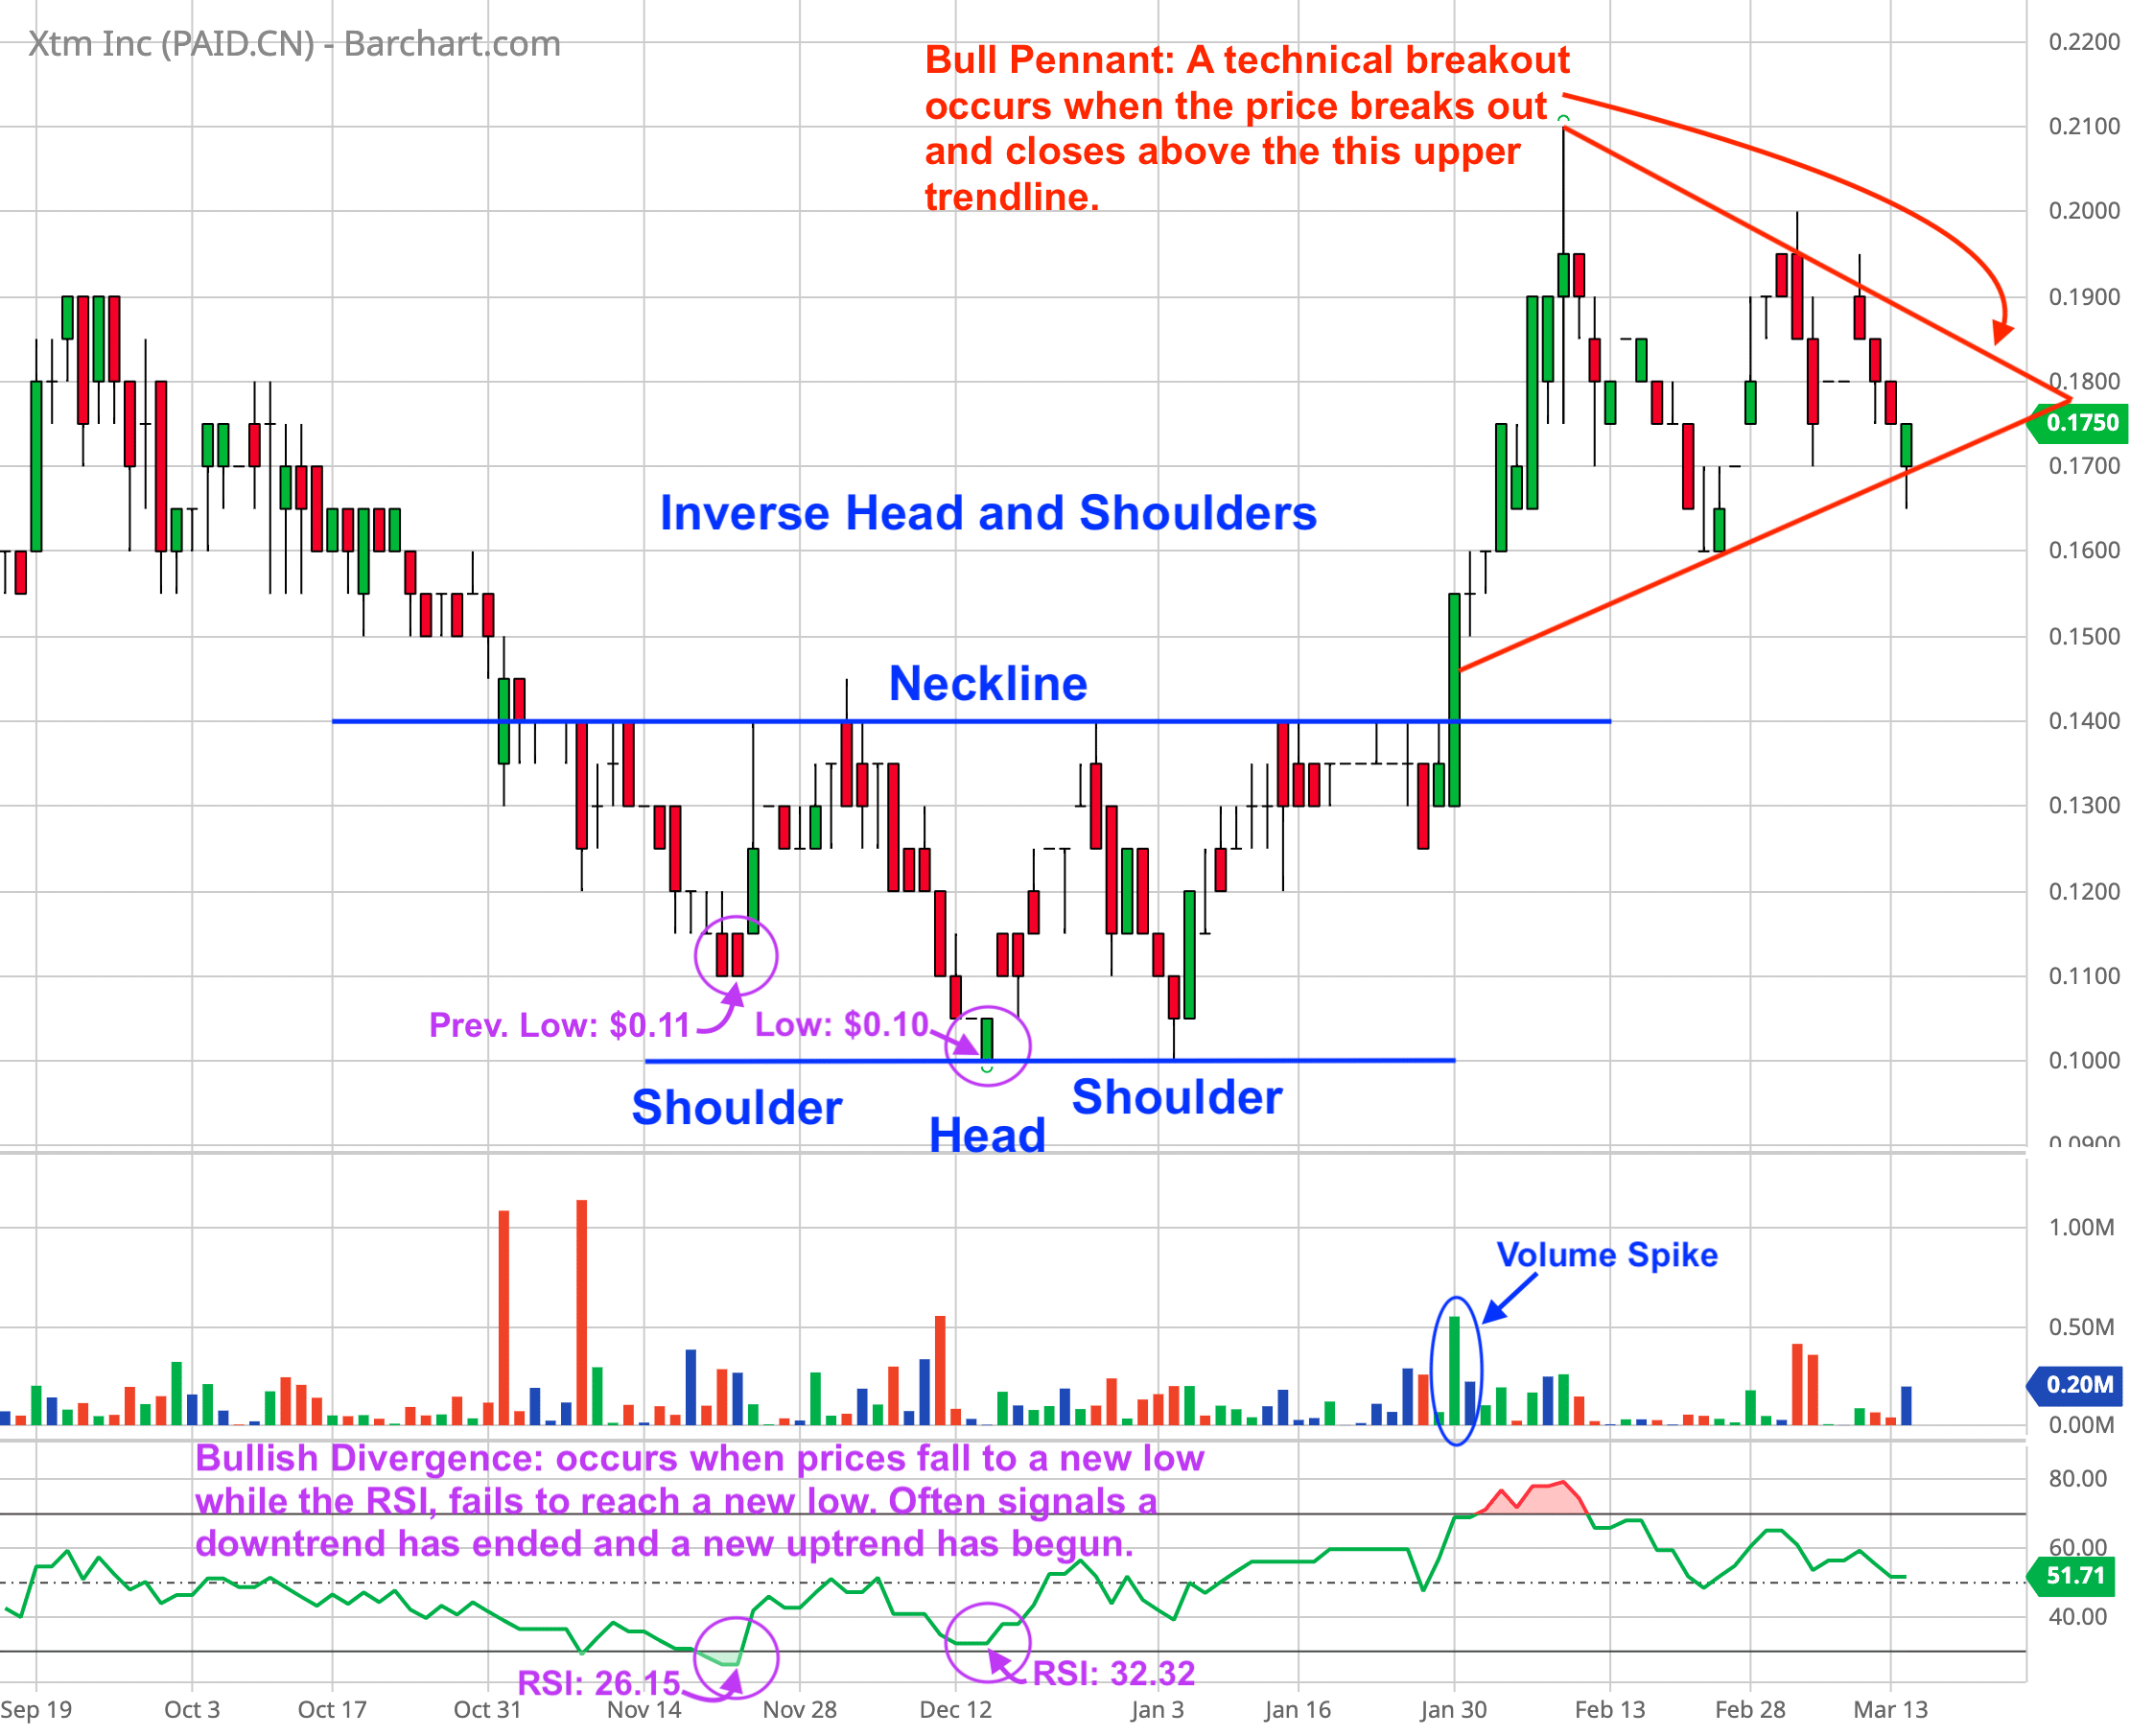
Upon reviewing the stock chart for XTM (CSE: PAID) and conducting a technical analysis of the company’s current situation, we determined that XTM likely experienced a reversal of its downtrend at the end of January 2023, which was followed by a significant upside move that culminated in the formation of a bullish chart pattern known as a “Bull Pennant.” Currently, XTM’s stock is in the process of completing this bull pennant pattern, which appears to be nearing its finish.
If the bull pennant pattern plays out as expected, a large breakout to the upside, followed by a continuation of the new uptrend, should be expected. Here’s why:
Bull Pennant
Bull Pennants are a type of chart pattern in technical analysis classified as a continuation pattern. Bull Pennants get their name because the pattern resembles the shape of a physical baseball pennant. As the name implies, the bull pennant continuation pattern suggests that, following a brief period of consolidation, the stock’s price will likely “continue” to move in the same direction as it was previously moving. In the case of XTM, that direction is upward.
Here’s How a Bull Pennant Chart Pattern is Formed:
- A stock experiences a large vertical movement to the upside. This creates the pattern’s ‘Flagpole.’
- After the vertical upside move, a period of consolidation follows where the support and resistance trendlines converge toward each other. The converging trendlines create the appearance of a ‘Pennant.’
- A successful Bull Pennant pattern is completed when the stock experiences a strong breakout above the upper trendline, which also provides technical traders with confirmation that the uptrend will continue.
Before XTM stock’s recent move to the upside, the stock had been in a nearly year-long downtrend. Before we get too excited about the newly formed bull pennant chart formation, we first need confirmation that the stock has bottomed and the recent upward move isn’t just a dead cat bounce.
Thankfully, we’re in luck, as the technical analysis on XTM has provided us with not just one but two reliable ways to validate that the stock has bottomed.
Here they are.
1. Inverse Head and Shoulders Pattern
You may have heard of the standard Head and Shoulders pattern, which is used to determine if a stock has topped out. The Inverse Head and Shoulders pattern is the inverted version of the standard Head and Shoulders formation and is used for spotting stocks that are ready to reverse a downtrend and begin a new uptrend.
The Inverse Head and Shoulders Pattern is Made Up of the Following Components:
- Shoulder: Following a long downtrend, the price of a stock drops to a trough, forming the first shoulder and afterwards rises to form a peak.
- Head: The stock’s price drops again to form a second trough, which is considerably lower than the previous low forming the head of the pattern, followed by the stock rising again.
- Shoulder: The price of the stock drops again for the third time to roughly the same level as the first trough, forming the second shoulder, followed by the stock rising one more time to break out above the resistance neckline of the Inverse Head and Shoulders pattern.
- Volume: Look for a spike in volume as the stock breaks out above the neckline. Volume is more important with the Inverse Head and Shoulders pattern than it is with the standard version. Strong volume will confirm the breakout’s validity. The higher the volume spike, the better.
2. Bullish Divergence
A Bullish Divergence occurs when a stock’s price falls to a new low while an oscillator, in this case, we’re using the Relative Strength Index (RSI), fails to reach a new low as well. The emergence of a bullish divergence signals to the market that the bears are losing control and that the bulls are ready to take back control. Very often, a bullish divergence provides reliable confirmation that a downtrend has ended and a new uptrend has begun.
Considering all the above information, there is a strong possibility, thanks to the confirmation provided by the Inverse Head and Shoulders Pattern and the Bullish Divergence, that XTM’s stock has bottomed. This gives credence to the recent upward move being the beginning of a new uptrend, and the current formation of a bull pennant pattern being a strong signal to investors that a continuation of this new uptrend is likely.
As of this writing, the share price of XTM (CSE: PAID) appears to be approaching the apex of the bull pennant pattern (see chart below) and, therefore, could experience a significant upside breakout within the next week or so.
With that said, it would be wise to add XTM (CSE: PAID) (OTCQB: XTMIF) (FSE: 7XT) to your breakout watchlist ASAP.
Read Next: Why Nvidia’s Tech Investments Could Transform the Entire AI Innovation Ecosystem
Join the Discussion in the WVC Facebook Investor Group
Do you have a stock tip or news story suggestion? Please email us at: invest@wealthyvc.com.
XTM Inc. (CSE: PAID) is a paid client of Wealthy VC.
This report/release/profile is a commercial advertisement and is for general information purposes only. We are engaged in the business of marketing and advertising companies for monetary compensation unless otherwise stated below.