How to Use the RSI Technical Indicator to Time Your Stock Trades
Whether you believe the price of a stock is going higher or lower, remember, the RSI never lies.
It’s no secret that stocks can be volatile at times. However, with the right tools and strategy, this volatility can work in your favour and help you generate more consistent gains.
In the world of technical analysis, a winning stock trader must have the proper tools and knowledge to successfully time the stock market. Technical traders must also be organized in their approach, disciplined in their execution and patient with the process.
Two questions I consistently receive from friends and colleagues are:
“When do I buy?” and “When do I sell?”
Although my response to these questions never includes a specific price target for them to buy or sell at, I’m happy to tell them how I would play the trade and provide them with the tools and information to conduct the technical analysis for themselves.
Armed with the right tools and their newfound market knowledge, my friends and colleagues are now in a position to answer the buy/sell questions for themselves.
In technical analysis, there are many tools at a trader’s disposal, with the most common type being technical indicators.
In addition to being able to properly use technical indicators, it’s also vital to have a trading plan before entering any trade.
Your trading plan doesn’t have to be complex; a simple plan that includes entry and exit price targets as well as a stop loss will suffice.
One of the biggest mistakes I see traders making is not having a plan or changing their plan mid-trade.
Create a plan, stick to it, and your trading life will be better off.
In regards to technical indicators, there is no need to load your charts up with a bunch of different indicators if you’re just starting out. One or two indicators will do the job.
I’ve always used Barchart for my technical charting because it has everything I need and it’s simple to use. Barchart is also free.
In this article, we’ll be discussing one of the more popular and easy-to-use technical indicators called the Relative Strength Index (RSI).
We’ll explain what the RSI indicator is and how you can use it to improve the timing of your stock trades. We’ll also go over a real-life example trade to showcase the RSI in action.
With that said, let’s proceed.
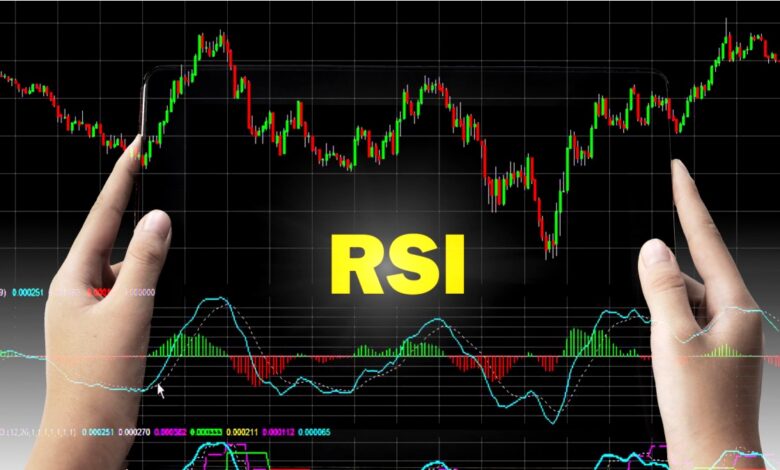
Relative Strength Index (RSI)
Investopedia describes the relative strength index (RSI) as:
“A momentum indicator that measures the magnitude of recent price changes to evaluate overbought or oversold conditions in the price of a stock or other asset. The RSI is displayed as an oscillator (a line graph that moves between two extremes) and can have a reading from 0 to 100.”
Simply put, if the RSI indicator is showing a reading of 70 or higher, it means the stock is in overbought territory, and it’s now likely that a pullback or correction is coming soon. This could be an ideal time to take some profits off the table or look to exit entirely and wait for an opportunity to re-enter. In extremely bullish situations, you can get an RSI reading of 85 or higher.
Exiting a position in multiple trades as the stock is moving higher past the 70 RSI level is one way you can attempt to maximize your exit prices. Remember, it’s ideal to buy on weakness and sell into strength. It’s unlikely that we’ll perfectly pick the top, so do your best to capture as much of the move as possible, but don’t worry if it’s not perfect. Profit is profit. The same goes for buying at the bottom. You will rarely ever call the bottom perfectly, either.
If the RSI shows a reading of 30 or below, it means the stock is now in oversold territory and could be considered undervalued. Stocks trading in this oversold range are usually due for a reversal or bounce higher. This could be a great time to enter a new position or add to an existing position. The number 30 should only be used as a gauge. Oftentimes, stocks won’t actually drop below 30 on the RSI. So, any reading in the 30s or even the low 40s can still make for a great entry point.
Now, let’s review the trade example below to give you a visual of the RSI in action.
Feel free to use this example as a template to start implementing this simple RSI strategy into your trading plan.
Please note that this is just an example and not an actual trade we made. We used the lows and highs of the stock to emphasize the example trade. Your actual trades may vary.
Trade Example Using the RSI
- Stock: Google (NASDAQ: GOOGL)
- Potential entry date: February 24, 2023
- Potential entry price: $89.44
- RSI: 38.43
- Potential exit date: May 22, 2023
- Potential exit price: $126.43
- RSI: 80.20
- Trade Duration: 3 Months
- Potential ROI: +41.36%

Notes: Normally, you won’t be fortunate enough to buy at the absolute bottom and sell at the exact top of any run. As we said, this is to show the potential of the trade and how to time entries and exits. Even if you bought in during the days leading up to the bottom or in the days following and exited in the week surrounding the top, you would have walked away with a nice profit.
Small Cap News Movers & Winner Deep Dive – By WealthyVC.com
We scan over 10,000 publicly listed stocks across all seven North American exchanges to uncover the market-moving news that actually matters—focusing on high-quality, liquid, growth-oriented companies in sectors attracting serious capital, like AI, blockchain, biotech, and consumer tech.
Each week, we publish Small Cap News Movers, a curated roundup of small and micro-cap stocks surging on meaningful catalysts. We break down what’s driving the move, tap into rumors swirling on social media, and surface sharp insights from both industry experts and retail sleuths.
From this list, we select one standout stock for our Small Cap Winner Deep Dive, released the next day, where we take a closer look at the fundamentals, narrative, and technicals that suggest this winner could keep running.
Powered by our proprietary 4-element, AI-driven analysis system, our goal is simple: cut through the noise, remove the emotion, and help investors dominate the small-cap market with momentum-driven strategies—completely free.
Sign up for email alerts to get the moves before our social media followers.
Read Next: Why Nvidia’s Tech Investments Could Transform the Entire AI Innovation Ecosystem
Join the Discussion in the WVC Facebook Investor Group
Do you have a stock tip or news story suggestion? Please email us at: invest@wealthyvc.com.
Disclaimer: Wealthy VC does not hold a position in any of the stocks, ETFs or cryptocurrencies mentioned in this article.